TACOMA
Get to know Tacoma’s homes, neighborhood settings, and waterfront with practical buying and selling guidance from Brian Side.
Get to know Tacoma’s homes, neighborhood settings, and waterfront with practical buying and selling guidance from Brian Side.
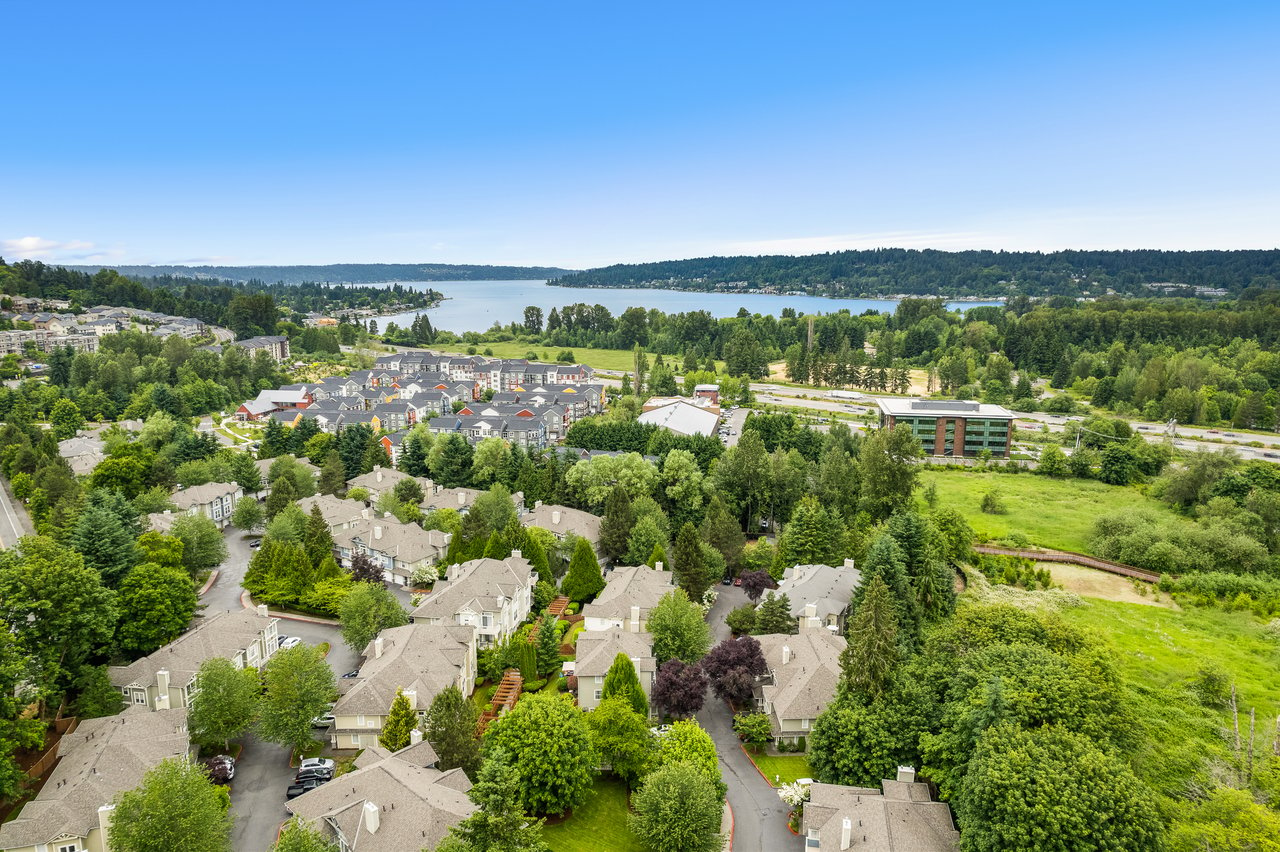
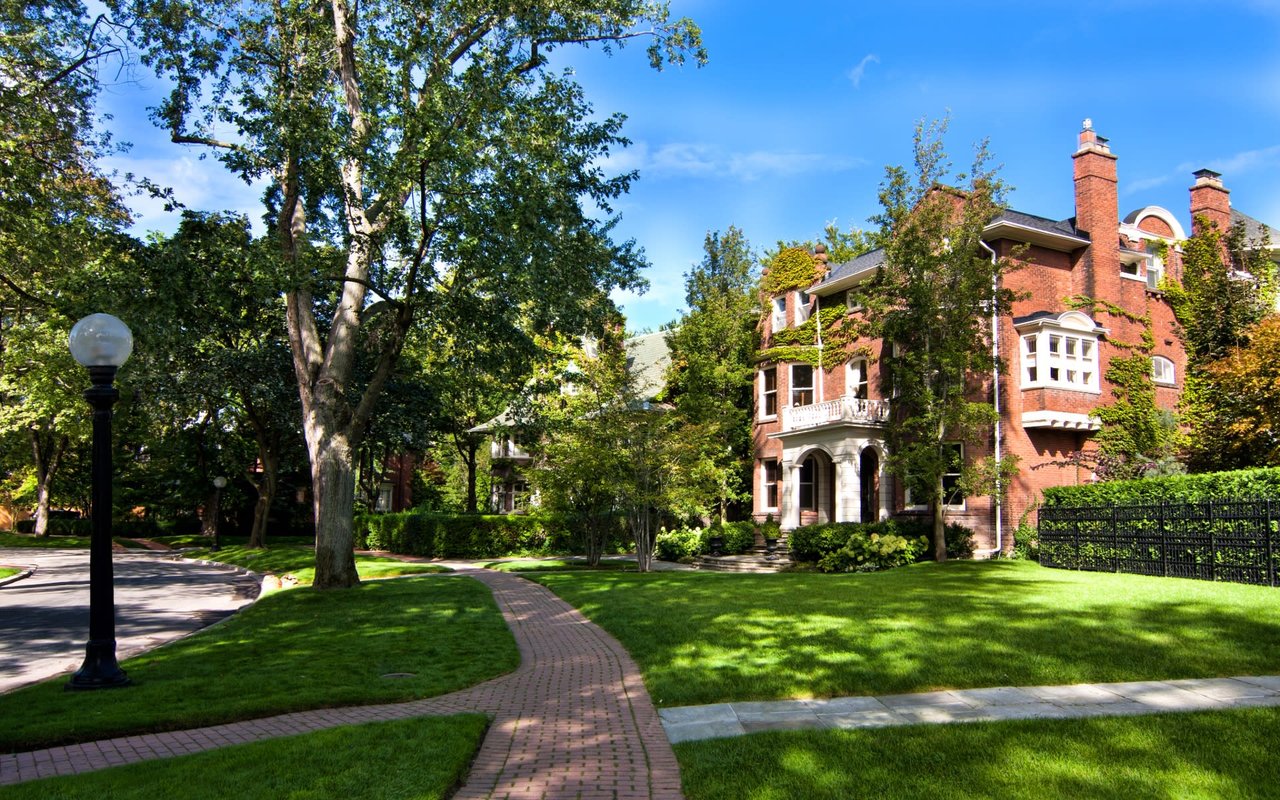
Tacoma has a character you notice in its homes, business districts, and waterfront. An older house near a neighborhood center offers a different experience from a downtown condo or a property farther from the core. The useful comparison starts with your routine, budget, and the kind of ownership you want.
I want you to understand the home beyond its presentation. How does the layout work? What needs attention? How do the surrounding streets fit your day? Those questions help us separate a good first impression from a property that makes sense for you.
Explore the North End, Proctor, Old Town, and downtown as you get to know the city. Compare the specific streets, nearby businesses, hills, parking, and routes to work. A neighborhood label can narrow your search, but it cannot replace time spent around the property.
Visit the waterfront and the places you expect to use regularly. If your search extends to nearby communities, verify city boundaries and service providers. A familiar area name and a property’s actual jurisdiction are worth checking separately.
An older home may have updates from several different periods. We’ll look at available records and identify questions about systems, drainage, previous work, and future maintenance. For a condo, we’ll consider association finances and responsibilities alongside the unit. Relevant sales help put those details in context.
We’ll start with the homes buyers are likely to compare yours with. Then we can discuss pricing, presentation, and which updates are worth considering. Before you commit to a project, you should understand how the cost and timing fit your overall sale.
Considering a move in Tacoma? Connect with Brian to discuss your options.
222,758 people live in TACOMA, where the median age is 37.2 and the average individual income is $45,650. Data provided by the U.S. Census Bureau.
Total Population
Median Age
Population Density Population Density This is the number of people per square mile in a neighborhood.
Average individual Income
There's plenty to do around TACOMA, including shopping, dining, nightlife, parks, and more. Data provided by Walk Score and Yelp.
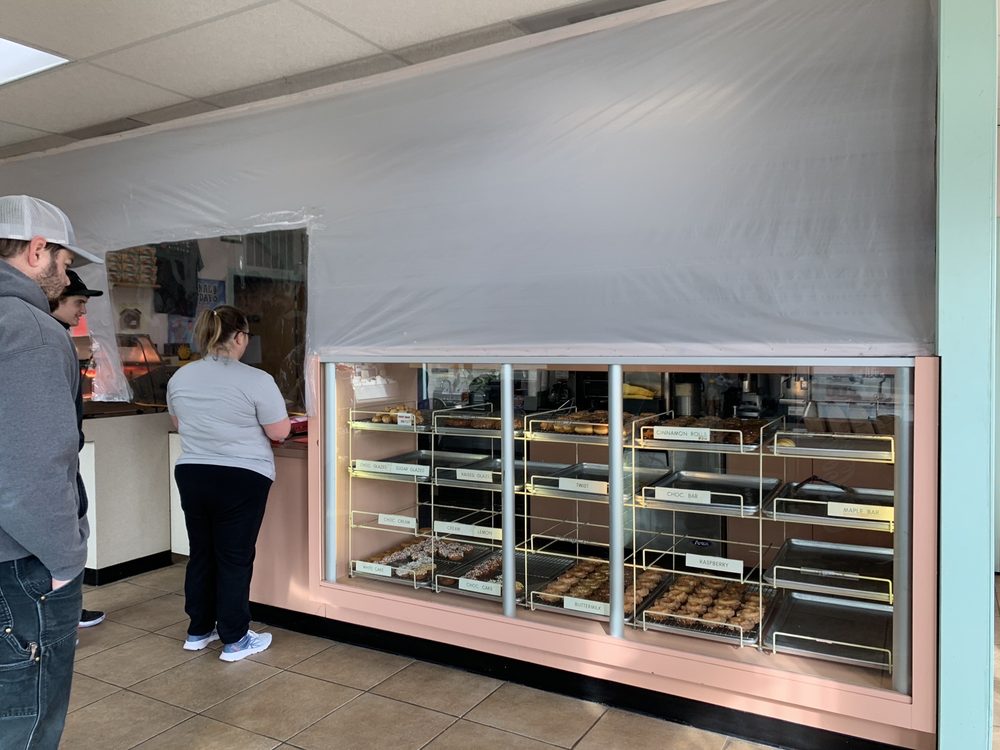
Explore popular things to do in the area, including Le Donut, S & S Market, and Olmec Agro-Tech.
| Name | Category | Distance | Reviews |
Ratings by
Yelp
|
|---|---|---|---|---|
| Dining · $ | 0.18 miles | 142 reviews | 4.5/5 stars | |
| Dining | 0.19 miles | 0 reviews | 0/5 stars | |
| Dining | 0.26 miles | 0 reviews | 0/5 stars | |
| Dining | 0.42 miles | 4 reviews | 3/5 stars | |
| Dining · $$ | 0.43 miles | 576 reviews | 4.2/5 stars | |
| Dining · $$$ | 0.54 miles | 3 reviews | 1/5 stars | |
| Dining · $ | 0.66 miles | 3 reviews | 4/5 stars | |
| Dining | 0.68 miles | 0 reviews | 0/5 stars | |
| Dining | 0.72 miles | 1 review | 5/5 stars | |
| Shopping | 0.71 miles | 0 reviews | 0/5 stars | |
| Active | 0.25 miles | 0 reviews | 0/5 stars | |
| Active | 0.46 miles | 0 reviews | 0/5 stars | |
| Active | 0.51 miles | 0 reviews | 0/5 stars | |
| Active | 0.59 miles | 0 reviews | 0/5 stars | |
| Active | 0.61 miles | 0 reviews | 0/5 stars | |
| Active | 0.71 miles | 1 review | 5/5 stars | |
| Active | 0.71 miles | 0 reviews | 0/5 stars | |
| Beauty | 0.42 miles | 0 reviews | 0/5 stars | |
| Beauty | 0.66 miles | 0 reviews | 0/5 stars | |
| Beauty | 0.7 miles | 10 reviews | 3.7/5 stars | |
| Beauty | 0.71 miles | 0 reviews | 0/5 stars | |
| Beauty | 0.71 miles | 0 reviews | 0/5 stars | |
| Beauty | 0.71 miles | 0 reviews | 0/5 stars | |
| Beauty | 0.72 miles | 0 reviews | 0/5 stars | |
|
|
||||
|
|
||||
|
|
||||
|
|
||||
|
|
||||
|
|
TACOMA has 93,033 households, with an average household size of 2.33. Data provided by the U.S. Census Bureau. Here’s what the people living in TACOMA do for work — and how long it takes them to get there. Data provided by the U.S. Census Bureau. 222,758 people call TACOMA home. The population density is 4,481 and the largest age group is Data provided by the U.S. Census Bureau.
Total Population
Population Density Population Density This is the number of people per square mile in a neighborhood.
Median Age
Men vs Women
Population by Age Group
0-9 Years
10-17 Years
18-24 Years
25-64 Years
65-74 Years
75+ Years
Education Level
Total Households
Average Household Size
Average individual Income
Households with Children
With Children:
Without Children:
Marital Status
Blue vs White Collar Workers
Blue Collar:
White Collar:
Unlock the door to your Seattle real estate dreams with Upside Properties. Experience the confidence and peace of mind that come from working with a team that puts your interests first. Contact us today to schedule a consultation with one of our knowledgeable agents and embark on an exciting journey towards finding your perfect home.
Get In Touch With Our Team To Learn More
2026 Fairview Ave E Seattle, WA 98102